Product details


Do you have any problems like this?
Focus Systems will solve that problem!
There is no solution other than "increase the amount of activity" to meet the ever-increasing sales targets.
Data aggregation and report creation take time, causing a time lag with the actual situation and making it difficult to make appropriate decisions.
01: Provide sales activity dashboard as a template
02: Streamline data aggregation and report creation with automatic report function
Features of Motion Board
■Easy operation that anyone can use
Dashboards can be created without programming and with simple drag-and-drop operations, allowing field workers to respond to requirements that change on a daily basis, reducing development costs and the burden on the IT department.
■More than 30 types of various charts
It supports not only familiar basic charts such as circles, bars, and lines, but also special expressions that are not used in general BI tools such as Gantt charts, Pareto charts, and 3D maps.

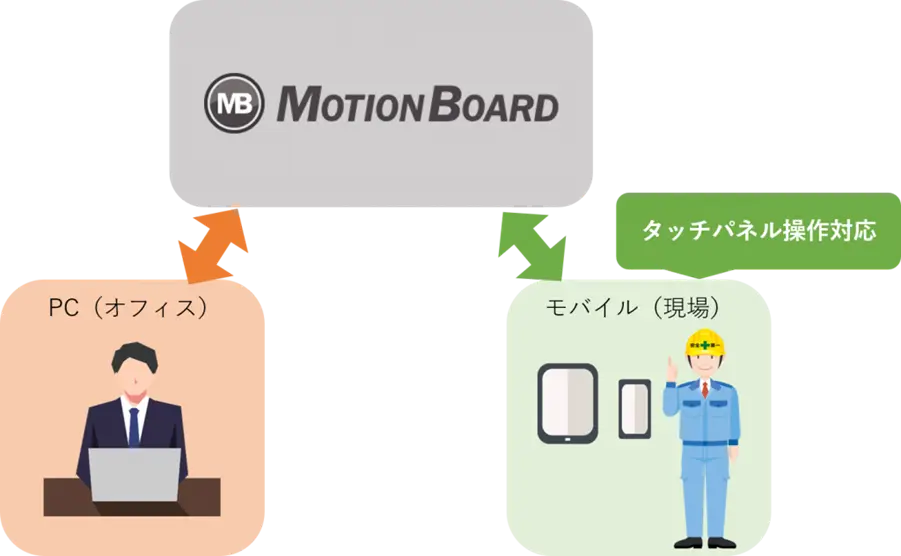
■Compatible with mobile devices
It can also be used on mobile devices such as tablets and smartphones, so even field employees can easily enter data regardless of time or place. In addition, development and design resources can be reduced because there is no need to develop for mobile devices.
Motion Board features
■Data visualization/analysis
Equipped with more than 10 types of analysis logic, it is possible to make more sophisticated decisions through multifaceted analysis. In addition, since a map function is included as standard, it can be used for visual visualization of regional trends, area marketing, etc.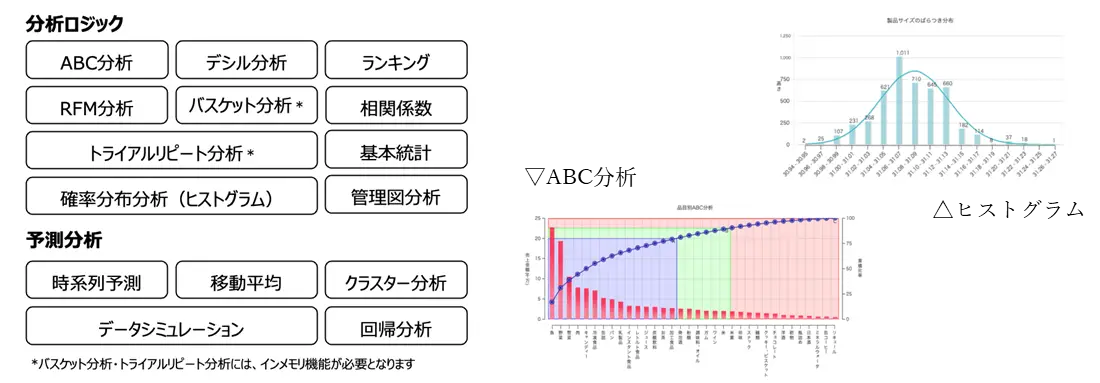
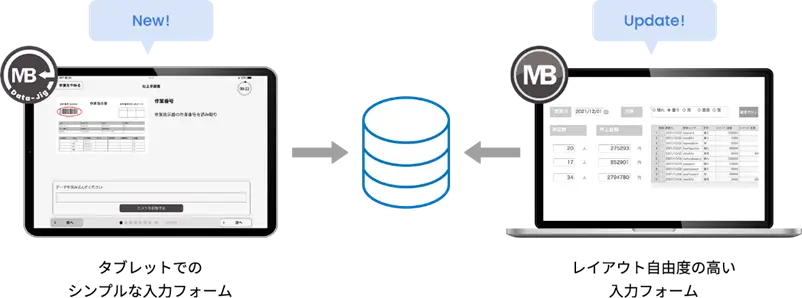
■Data input function
In addition to aggregating and analyzing data, you can input data into databases and files like a business application, so you can seamlessly aggregate supplementary data that is essential for enriching your analysis, such as budgets, forecasts, and activity records.
Related product
invoiceAgent
electronic ledger platform
・Reliable document management that complies with the Electronic Bookkeeping Act ・Converts documents into data using high-precision character recognition ・Batch operation of sending and receiving transaction documents

SVF
Comprehensive report platform
・Easily create forms ・High-speed, large-capacity printing regardless of printer ・Chart generation in multiple languages and form output in 26 languages

Dr.Sum
Data analysis platform
・Easy to use interface ・High-speed aggregation of large amounts of data ・Reliable Japanese-made BI tool
inquiry
Achievements left behind
48 years since its establishment.
We have a proven track record because we have focused on what is important.
It has a long track record in both the public and private sectors.
Number of projects per year
500 PJ
Annual number of business partners/customers
200 companies
Maximum number of trading years
47 years
Total number of qualified persons
1,870 people